S-Curve is an S-shaped curve that is a cumulative graph of certain variables (costs, man-hours, etc.) which are calculated against time.
There are several kinds of S-Curve presentations in the project according to the required data display:
- S-Curve, which represents the cumulative cost against time.
- S-Curve represents the cumulative man-hours (units) against time.
- S-Curve represents the performance (time & progress percentage) related to EVM.
In primavera, you can display the s-curve by first assigning resources which will cause variable costs and man-hours for each activity in a certain period.
There are several types of resources that you can assign to activities in Primavera P6, as below:
- Labor.
- Non-Labor.
- Materials.
Assign Resources to Activities
Before creating an S-Curve for your project, you must determine the resources involved in each activity.
You can assign specific resources according to the activities to be done.
Previously you needed to input the data Resources first in Primavera.
Below are given Resource data that can be inputed in Primavera as an exercise. So that you can easily try it, I created dummy data as follows:
Create a Resource with the following details:
- Resource ID: DMME;
- Resource Name: Dummy Engineer;
- Resource Type: Labor;
- Max Units / Time: 10h/day;
- Standard Rate: $10/hour.
To create a dummy resource above, do the following:
Go to the Enterprise menu -> Resources…
After that, the New Resource Wizard window will appear; fill in the Resource ID and Resource Name fields as shown below:

Click Next.
Next, in the Resource Type window, leave the default Labor option.

Next, complete the Unit / Time & Prices data. See the contents in the image below:

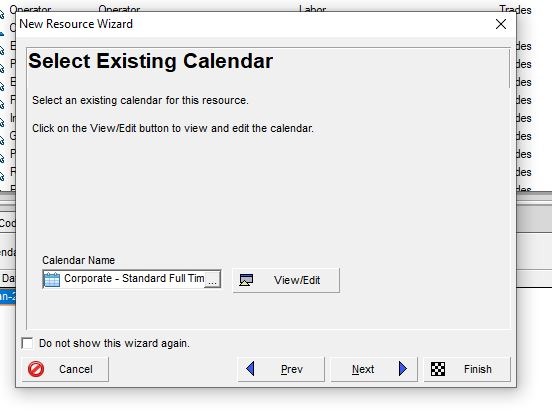
Next, in the Select Existing Calendar window, select the same calendar as the default calendar on the project. Click Next.
In the Auto-Compute Actuals window, select Do-not auto compute actual.

Click the Finish button when you are finished.
Continue by going to the activities table on the previously created project, the Haitang Corporate Park project.
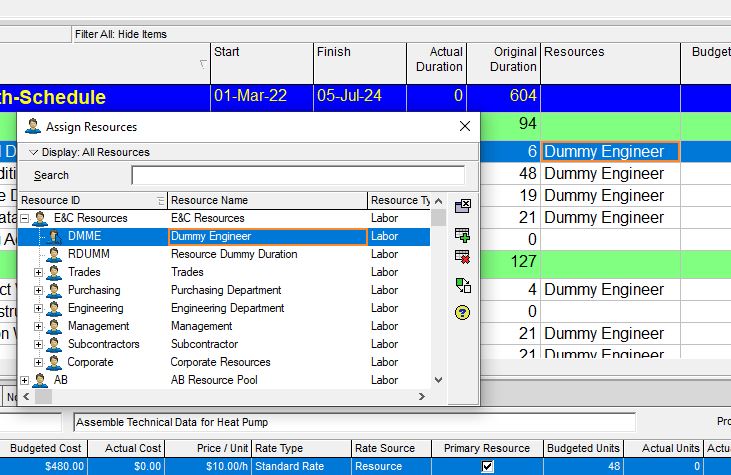
In the Resources column, input the resource named Dummy Engineer we created earlier.
Input Dummy Engineer resources in all activities.

Remember, this is just an example. During implementation, you can input more than one resource for each activity.
You can also input labor, non-labor or material type resources.
To input, all data at once, select all rows in the activity in the Resources column, then click the Assign (+) button in the Assign Resources window.

Then click the close button in the Assign Resources window.
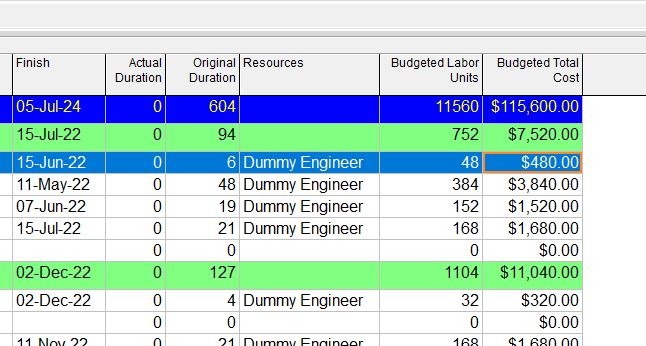
After you input resources data, the Budget Labor Units and Budget Total Cost columns are automatically accumulated.
You can see in the picture below, that the accumulated value of Budget Labor Units is 11560 and the Budget Total Cost is $115,600.
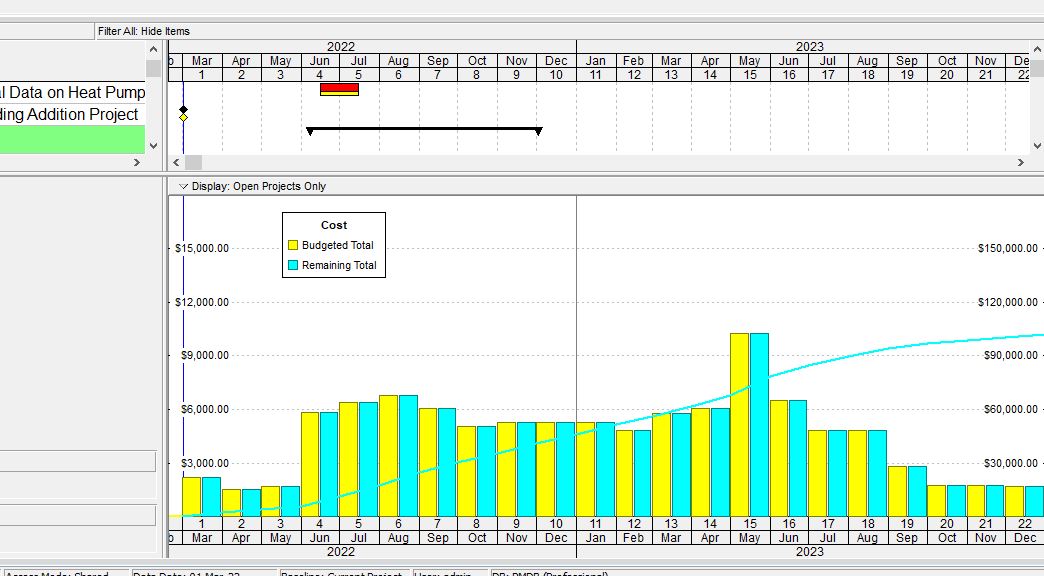
Then you can see the s-curve formed based on accumulated costs or units (manpower) against time.
Show and Configure S-Curve Graph in Primavera P6
To show the S-Curve, go to the View menu -> Show on Bottom -> Activity Usage Profile.

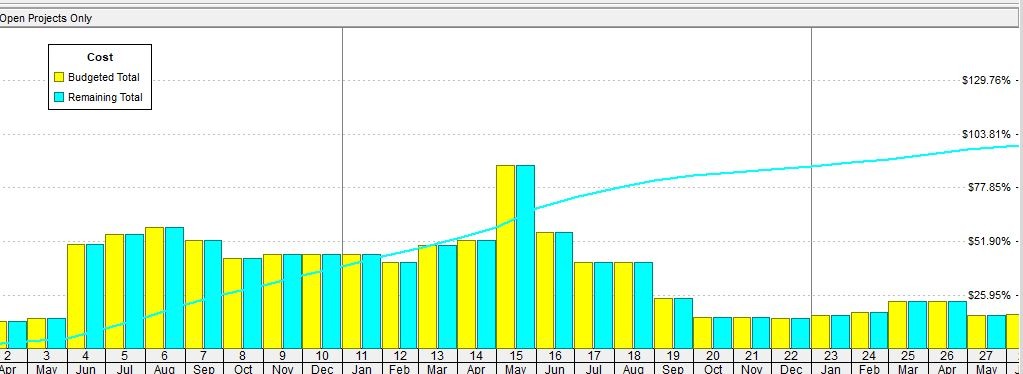
Cost vs. Time S-Curve
At the bottom, an s-curve window will appear in the value of accumulated cost over time.
You can make the configuration as below:
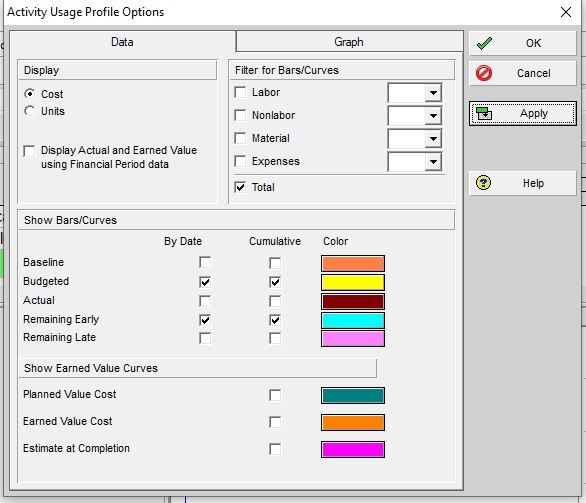
Right-click on the graph, and click on Activity Usage Profile Options…
Configure the graph as below:
Manpower vs Time S-Curve
The following is an s-curve in the form of the accumulated value of units or manpower against time.

To display the s-curve above, you can make a configuration like the one below.
Right-click on the graph, and click on Activity Usage Profile Options…
Configure the graph as below:

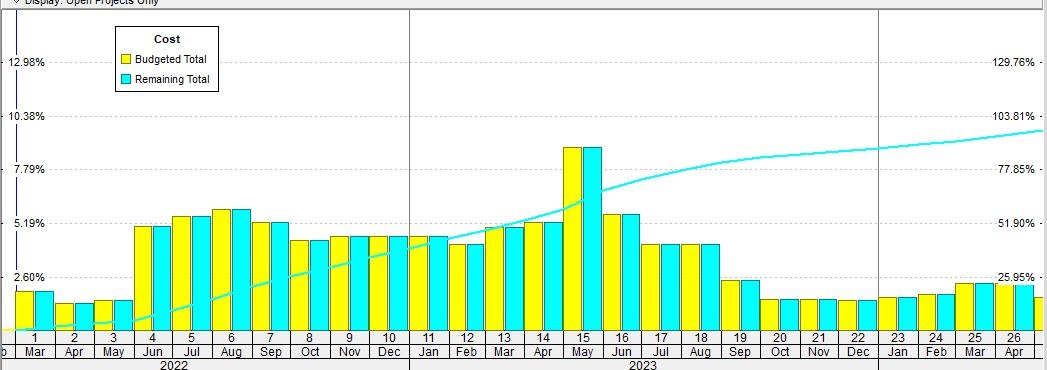
S-Curve in Percentage
You can make both s-curves above in percentage values as follows:
For the s-curve Cost vs. Time, you can do the following configuration:
Right-click on the graph, and click on Activity Usage Profile Options…
Go to the Graph tab.
Click the Calculate Average column.
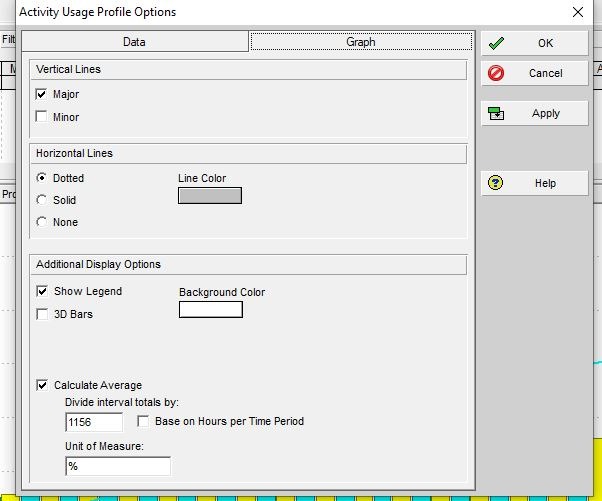
In the Divide interval totals by section, divide the total cost ($115,600) by the value that produces 100 (divide by 1156).
Then in the Unit of Measure, fill it with the symbol %.
To get rid of the dollar symbol, you can configure it by:
Go to menu Edit -> User Preferences…
In the User Preferences window, click the Currency tab, and uncheck Show currency symbol.

S-curve in percentage will show as below:
In the same way, for the unit vs. time s-curve for the Units option, the percent symbol cannot be displayed, so you need to modify it (a little tricky) by changing to the Cost configuration.
To do this, change the resource rate to $1 (per hour) so that the percent cost displayed represents the percent manhour value. Also, you need to back up your project data first.


