In the realm of project management, the S-curve serves as a powerful tool for understanding and predicting the trajectory of a project’s progress over time.
By analyzing the S-curve, project managers gain valuable insights into the stages of project development, allowing them to make informed decisions, allocate resources effectively, and ultimately drive project success.
This article explores the significance of the S-curve in project management and provides a comprehensive understanding of its four distinct stages.
What Is an S Curve in Project Management?
An S-curve is a graphical representation of the cumulative progress or growth of a variable over time. It is called an S-curve because the graph generally resembles the letter “S” in shape.
The S-curve is commonly used to describe the pattern of growth, adoption, or performance of various phenomena, including technology, products, projects, and market trends.
In an S-curve, the horizontal axis represents time, while the vertical axis represents the cumulative value of the variable being measured.
Initially, there is slow progress or growth, followed by a rapid acceleration, and then a gradual leveling off. The curve starts with a gentle slope, then steepens in the middle, and eventually flattens out.
The S-curve can have different interpretations depending on the context.
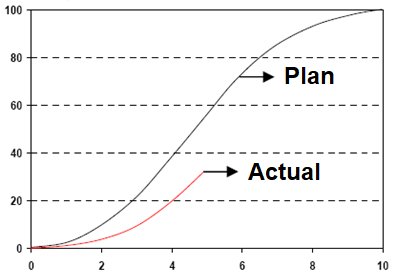
In project management, the S-curve is used to track the cumulative progress or cost of a project over time. It shows the project’s initial slow start, followed by a period of rapid progress, and then a slower rate of completion as the project nears its end.
The S-curve provides valuable insights into the pattern of growth, adoption, or progress for various phenomena.
It helps stakeholders understand the dynamics, anticipate changes, and make informed decisions based on the current stage of the curve.
Four Stages of an S-Curve
The S-curve framework within project management helps visualize the cumulative progress, effort, or cost of a project against the timeline.
It unveils the patterns of growth and challenges that projects typically encounter as they evolve from initiation to completion.
By recognizing these stages, project managers can anticipate potential roadblocks, implement appropriate strategies, and ensure the project stays on track for successful delivery.
The First Stage of the S-curve
The first stage of the S-curve, known as initiation or startup, sets the foundation for the project. During this phase, project objectives are defined, stakeholders are engaged, and the project team is assembled.
Progress is relatively slow as the project establishes its groundwork and navigates initial challenges. It is crucial to lay a solid foundation during this stage to ensure a smooth transition into the next phase.
The Second Stage of the S-curve
The second stage of the S-curve is the growth or acceleration phase. At this point, the project gains momentum, and progress accelerates rapidly.
Key activities are executed, milestones are achieved, and significant strides are made towards project objectives.
This stage requires effective coordination, efficient resource management, and clear communication to capitalize on the project’s growth potential.
The Third Stage of S-Curve
Following the growth phase, the project enters the maturity or stabilization stage. The progress rate starts to slow down as the project approaches its final deliverables.
During this stage, the project team focuses on completing remaining tasks, mitigating risks, and ensuring all requirements are met.
Attention shifts to quality control, stakeholder engagement, and fine-tuning project details to achieve optimal outcomes.
The Fourth Stage of S-Curve
The final stage of the S-curve is closure or completion. As the project nears its end, the remaining tasks are finalized, and the project is handed over to the stakeholders.
The effort, cost, or performance reaches its peak and then begins to decline as the project concludes.
A comprehensive review is conducted to evaluate project outcomes, identify lessons learned, and capture valuable insights for future projects.
Applying of S-curves
There are several s-curves possible for use in project management. The following are listed:
- S-Curve for the Baseline
- S-Curve of Costs and Time
- Percentage S-Curves
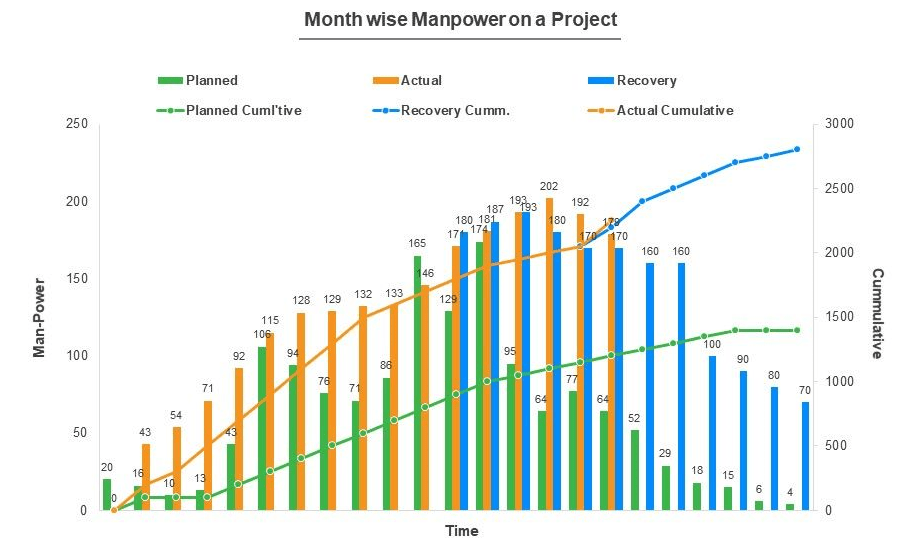
- S-Curve of Man-Hours vs time
- S-Curve of Baseline and Actual
Why S Shaped?
Actually, the S-Curve is not always perfectly shaped like the letter S. The curve is often S-Shaped because progress will look more sloping in the early stages of the project.
This is because the workload in the early stages usually has a low weight, and the need for manpower is not as many as the main work.
For example, in the early stages of a construction project, the work carried out: permit, site clearing, utility removal, traffic management, design, etc.
The main work will usually start when the project runs 5 to 10 percent of the overall progress. Hence after a certain period, the project curve will rise significantly.
Furthermore, when the project is nearing the end, the curve will slope because the weight of the work is decreasing.
That’s why curves are often S-shaped.
What are the most often used applications of the S Curve in project management?
S-Curves are advantageous for a variety of functions during the project’s life. Several of the most critical applications of S-Curves are covered below:
1. Evaluation of Performance and Progress
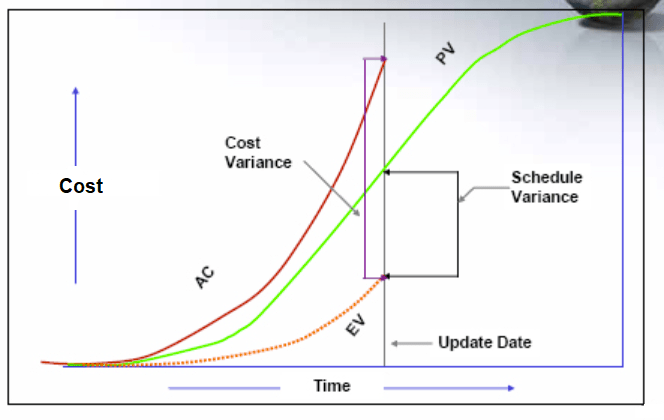
S-Curves are mainly used to evaluate the progress and performance of a project. This can be done by using Earned Value Method (EVM).
S-Curve graphs are often created as part of the EVM process and give the necessary information for evaluating the progress and performance of a project.
Numerous elements must be considered while determining the project’s present state and forecast projections.
They are as follows: Budget at Completion (BAC) also known as Project Budget, Budgeted Cost of Work Scheduled (BCWS) also known as Planned Value; Budgeted Cost of Work Performed (BCWP) also known as Earn Value; Actual Cost of Work Performed (ACWP) also known as Actual Cost.
The calculation of these four elements are as follows:
- BAC = Project Budget.
- AC = Actual Cost of the Project.
- PV = Percent Complete (planned) x Project Budget.
- EV = Percent Complete (actual) x Project Budget.
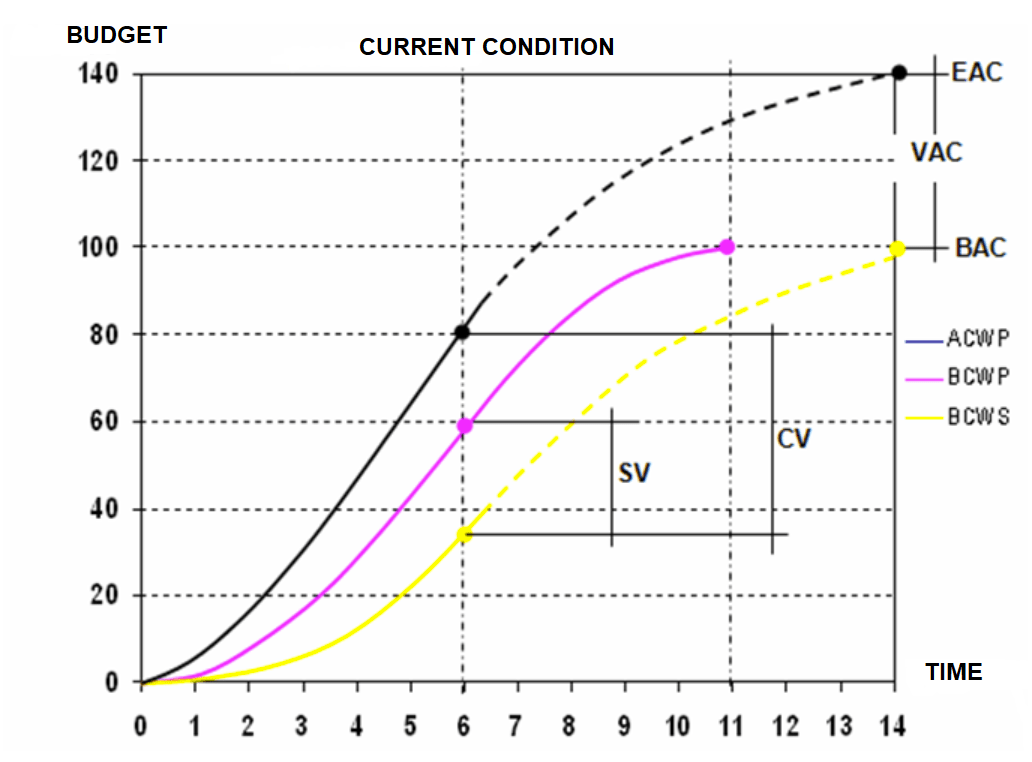
This comparison is beneficial because if you want to know whether a project is going over budget or if another work is falling behind schedule, you can quickly look at the graph.
It will provide you with the information you need.
2. Forecasts of Cash Flows
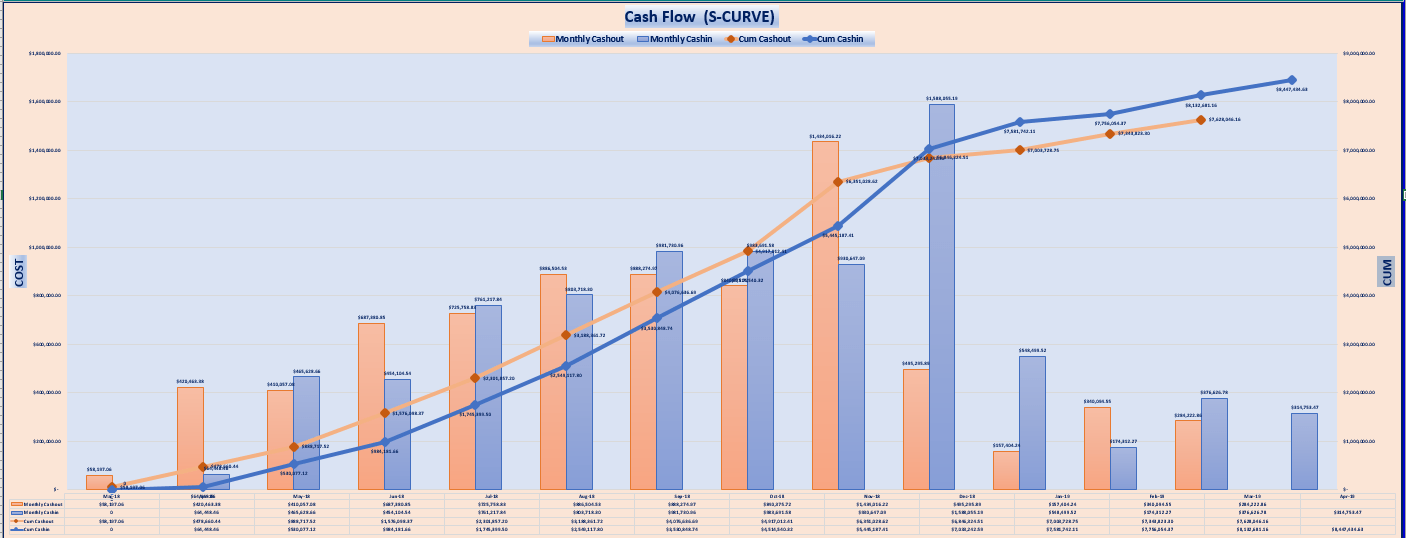
Cash flow forecasting is a financial management technique that involves estimating the amount and timing of cash inflows and outflows for a business or project.
It is essential for organizations to have a clear understanding of their expected cash flow to effectively plan and manage their finances, make strategic decisions, and ensure sufficient liquidity.
The S-curve helps identify different stages of cash flow patterns, such as the initial slow growth, rapid acceleration, stabilization, or decline, and assists in understanding the underlying factors influencing these stages.
By utilizing the S-curve to forecast cash flows, businesses can anticipate potential cash flow fluctuations, identify periods of high or low cash availability, and plan accordingly.
This enables them to make proactive financial decisions, manage working capital effectively, optimize resource allocation, and ensure financial stability.
3. Comparison of Quantity Output
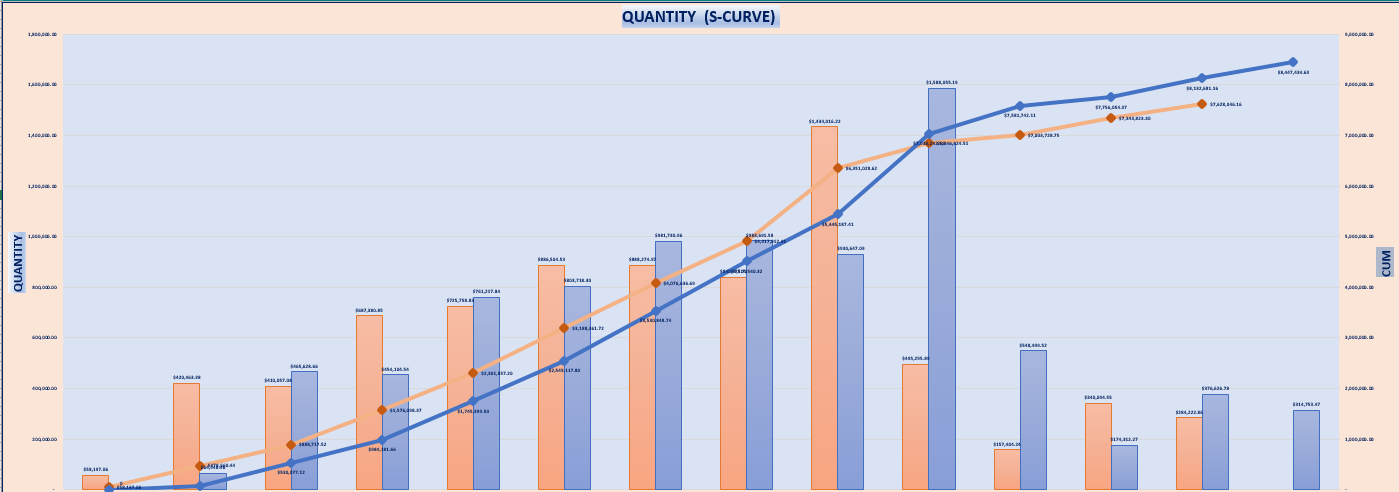
The S-curve for comparison of quantity output can be applied in various contexts, such as manufacturing, construction, project management, or productivity analysis.
It provides a visual tool for understanding the growth patterns, identifying outliers, and facilitating data-driven decision-making.
4. Possibilities Range for Schedule (Banana Curves)
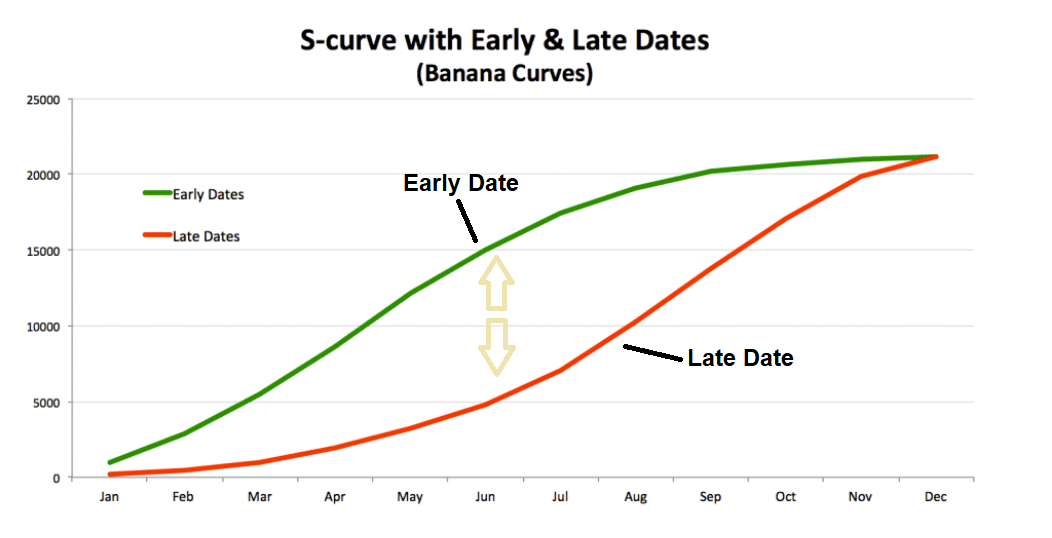
This is perhaps the most critical use of S-Curves. As is well known, the majority of scheduling software can readily elicit S-Curves from schedulers via parameters such as Quantity, Man Hours, Cost.
The banana shape curve indicates the range of possible completion dates for the project.
This program can generate the following s-curves.
- The first line may be formed based on the earliest dates.
- The second line of S-Curve may be based on latest dates.
These two forms of S-Curves often intersect at the project’s beginning and finish. They take on the shape of a banana, therefore the name Banana Curves.

My work experience includes roles as Project Control, Planner, Scheduler, and more. My responsibilities include fulfilling project manager needs in multinational companies by analyzing and presenting project feasibility related to planning (master schedule), monitoring and coordinating project schedules/progress, conducting delay analysis (EoT - Extension of Time), and mitigation analysis.
- Apa Itu Bored Pile dan Bagaimana Cara Menyusun Jadwalnya? - May 9, 2026
- Mengatur Time Periods di Primavera P6 Agar Durasi Proyek Akurat - March 14, 2026
- Cara Memilih Teknik Delay Analysis yang Tepat dalam Proyek - March 14, 2026


