Timescale is a feature for setting the display of periods on a bar chart or Gantt chart. You can choose the timescale for years, quarters, months, weeks, and even hours.
The timescale between Primavera and Microsoft Project is similar but has different features in terms of appearance and completeness.
One of the main features of Timescale in Primavera and Microsoft Project (version 2021) that I want to show here is when we want to display the timescale in interval form.
Timescale in interval form is when we want to display the project period in the form of month to… or week to… or year to…You can easily display the time scale in interval form in Primavera and in Microsoft Project.
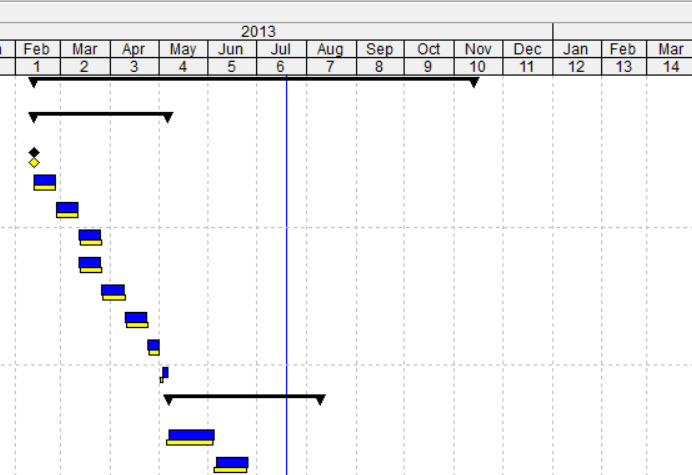
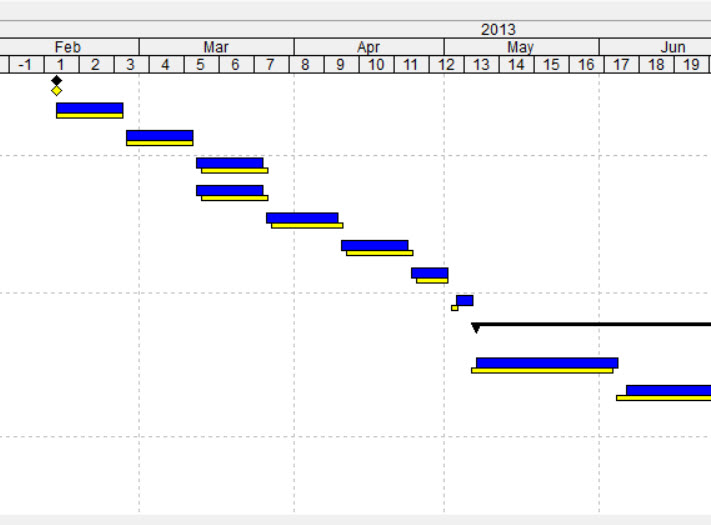
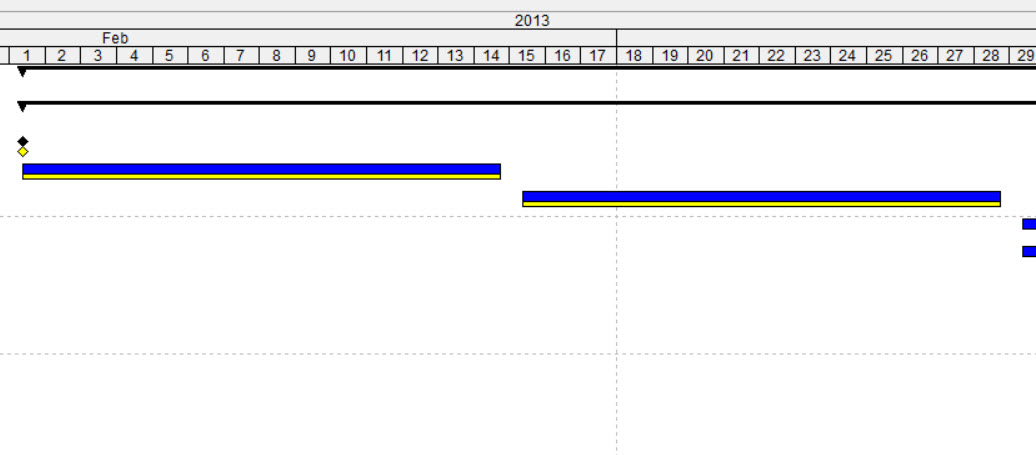
The following displays the time scale in interval form in Primavera:
Monthly Intervals
Weekly Intervals
Daily Intervals
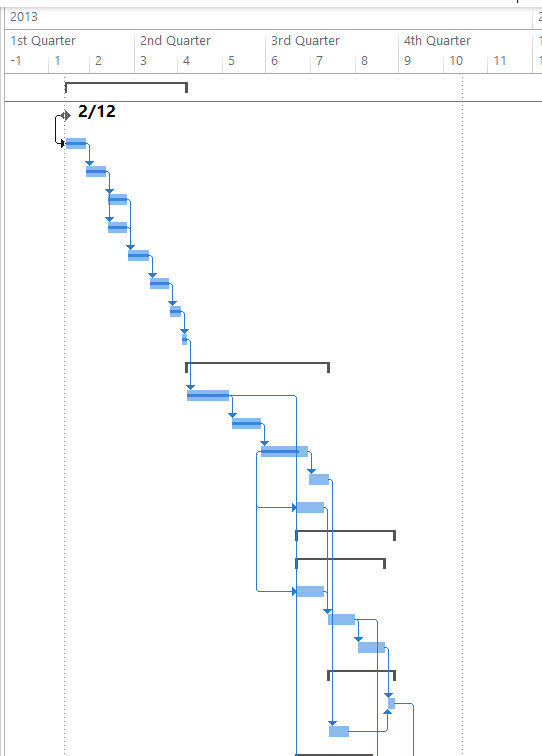
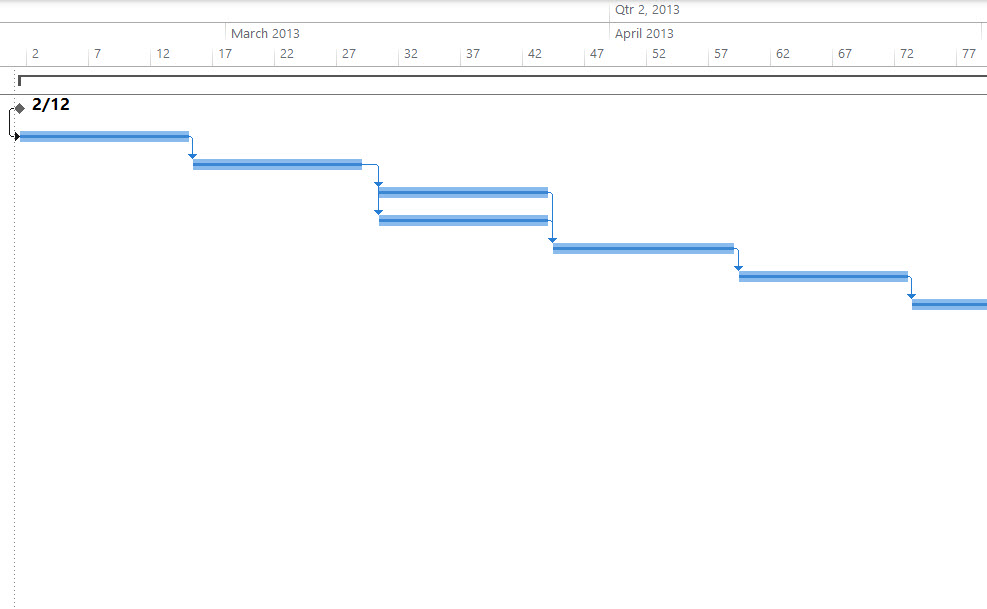
The following displays the time scale in interval form in Microsoft Project:
Monthly Intervals
Weekly Intervals
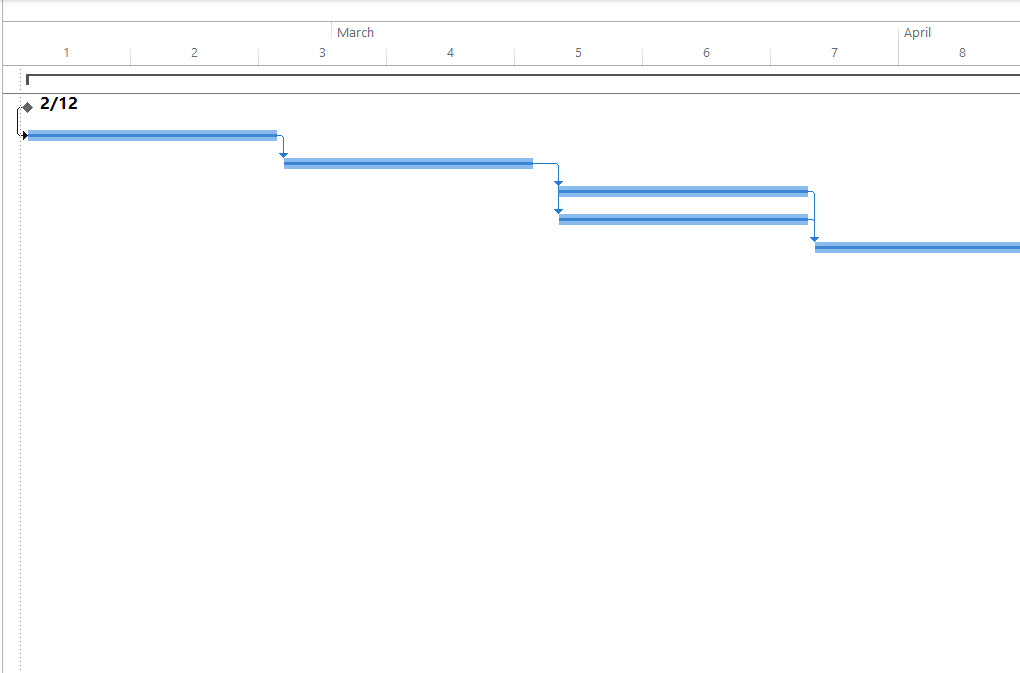
Daily Intervals
The main difference between the timescale in Primavera and Microsoft Project is the financial Period in Primavera.
Financial Period is a custom period defined by Primavera users to store actual data according to the desired (defined) period.
When using the Financial Period, the data displayed is not prorated, but the actual data is accumulated according to the period that has been defined.
This is one of my favorite features of Primavera because it displays more precise data than monthly or weekly prorated data.


