Before adding an activity, you need to do the following things, as follows:
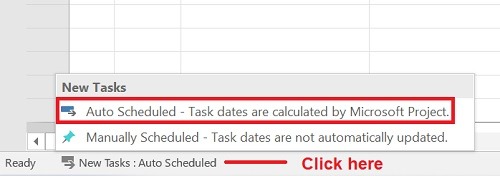
- Change the default of the new activity to Auto scheduled. The fastest way is to click on the lower left of the Gantt Table select Auto Scheduled.
- We also already configure project worksheet, project information and project calendar previously.
The thing you need to do before adding activities is to create work categories or Work Breakdown Structure (WBS). You can make this WBS multilevel up to several levels and accumulate activities data below it.
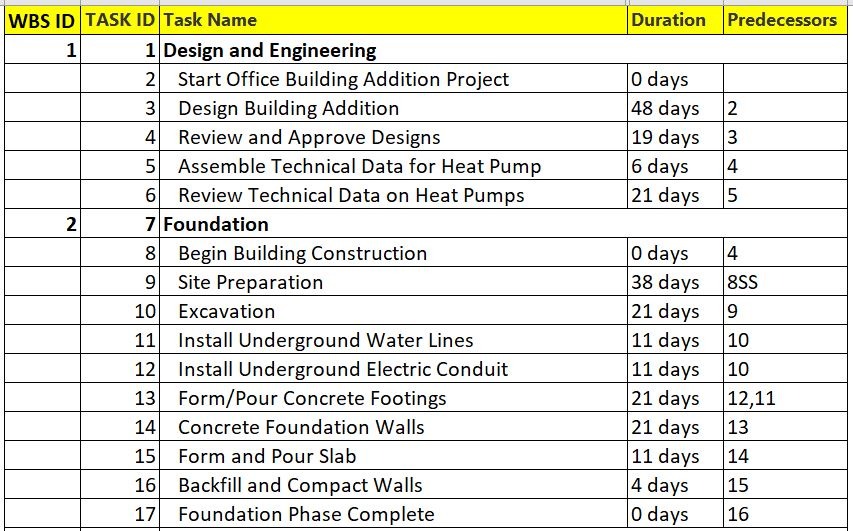
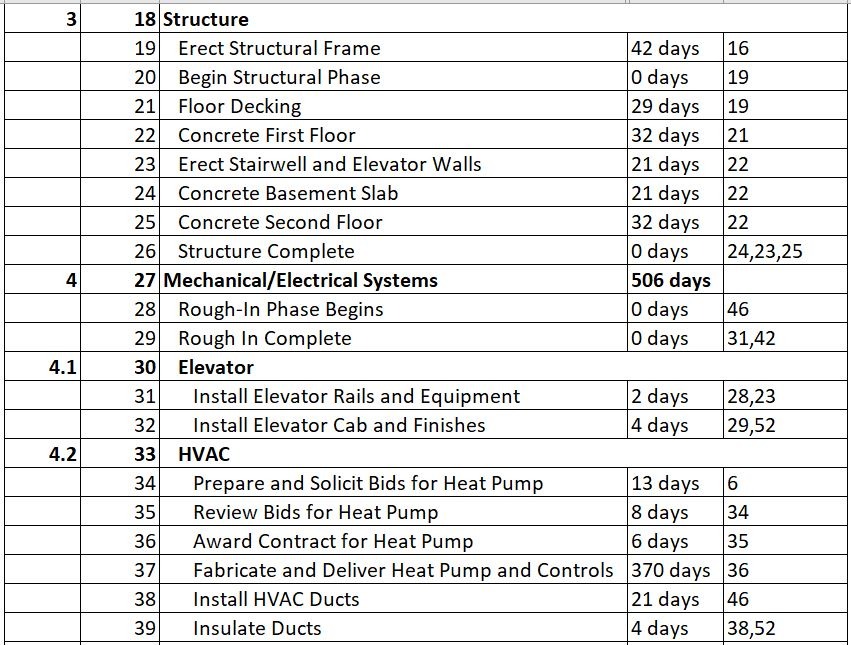
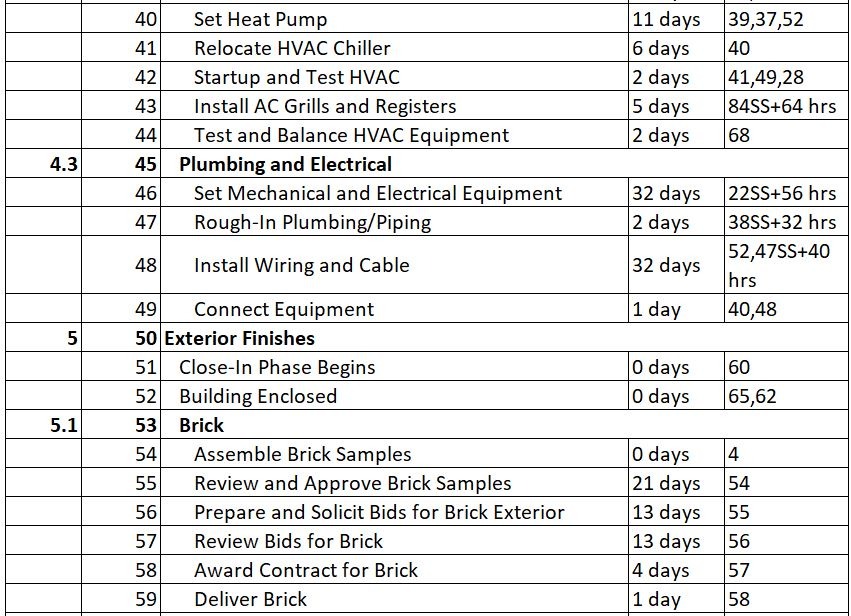
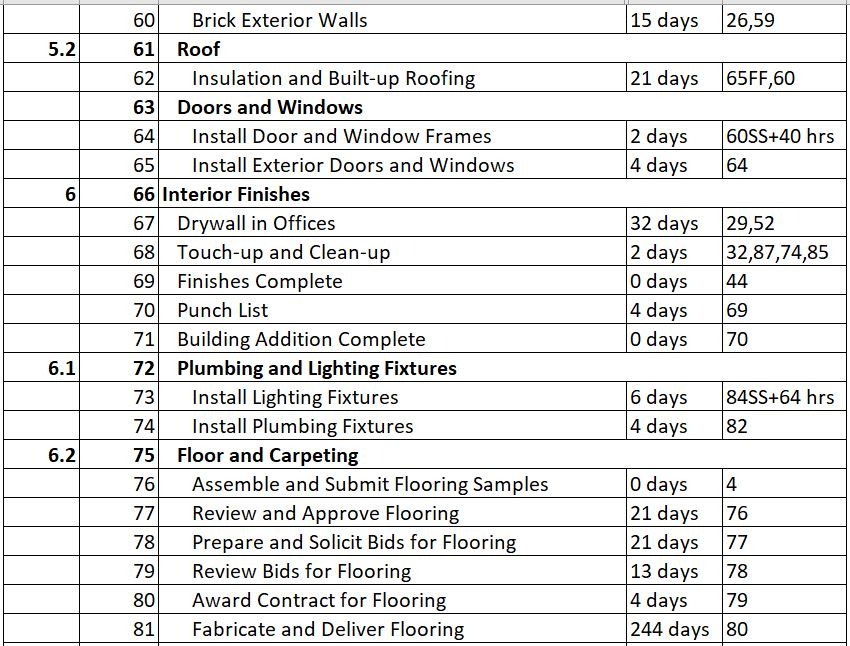
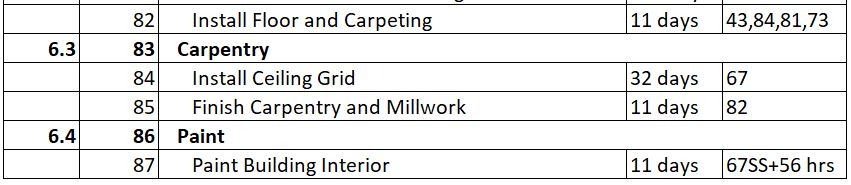
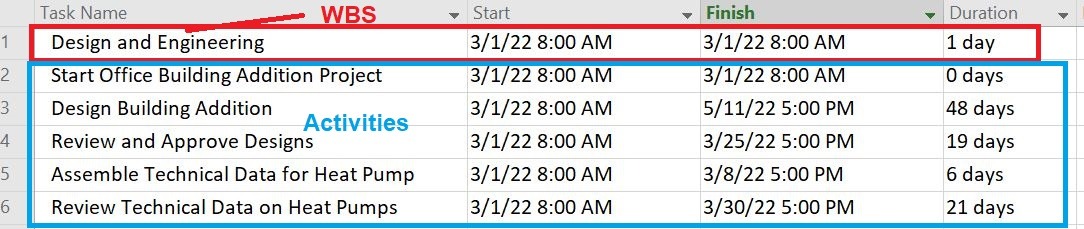
The following are activities data that you can input as an exercise. Data marked in bold are WBS, while other data are activities.
Create Activities and WBS
How to create a WBS and add Activities are as follows:
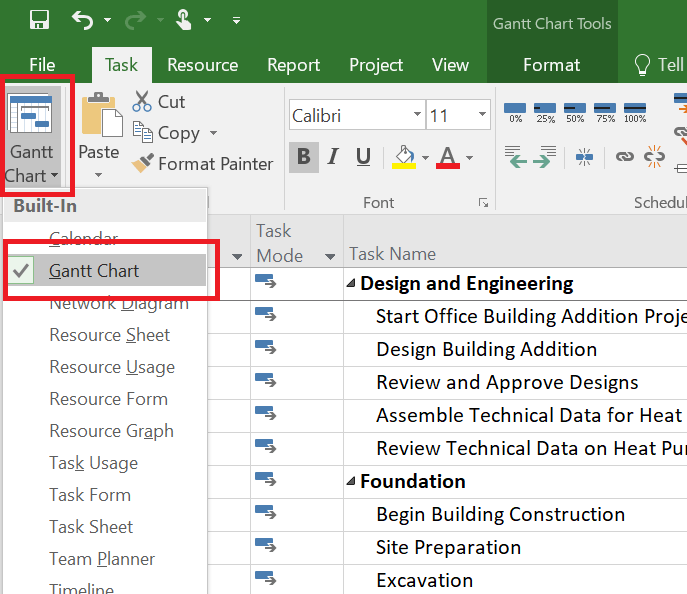
- Go to the Gantt Chart page.
To access it, click the tab Task -> select the Gantt Chart menu, click Gantt Chart.
- Type the name of the WBS in the Task Name field in the Gantt Table. Next, type the Activitis Name (in the Task Name column) below the WBS level that you have created.
Because you have configured Task Mode with Auto Scheduled and we already configure Auto scheduled tasks scheduled on: Project Start Date (in File -> Options -> Schedule), the date in the Start and Finish fields for each task is automatically filled with the project start date. For now, leave it as it is.

Also, input the duration of each activity according to the table above.
- Make sure the task Type selected for each activities is Fixed Duration.
- Distinguish between WBS and Activities.
To distinguish the hierarchy between WBS and activities, do the following:
- Select activities that are below the WBS level.
- Go to the tab Task -> click the right arrow in the Schedule group (see image below).
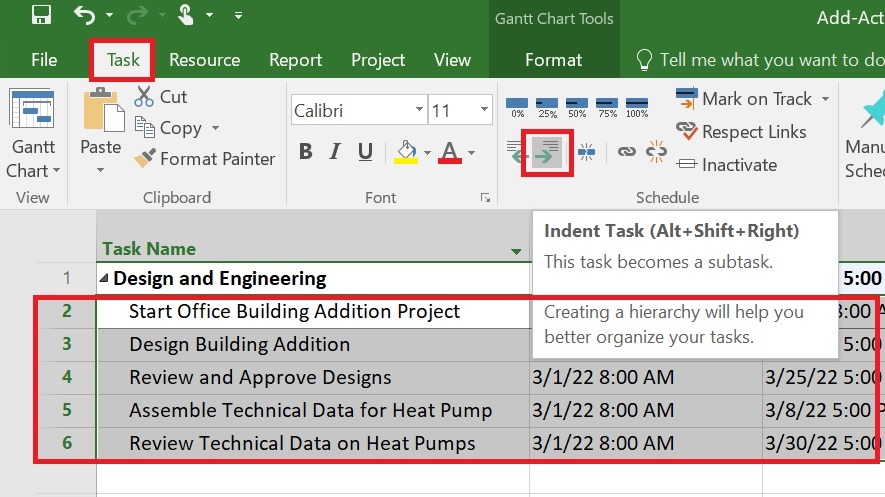
Note: Right arrow to create sub-task. Left arrow to create a summary task (WBS).
- Continue to fill in the data according to the table above. Start with WBS, continue by creating the name of the activities, followed by filling in the Duration column.
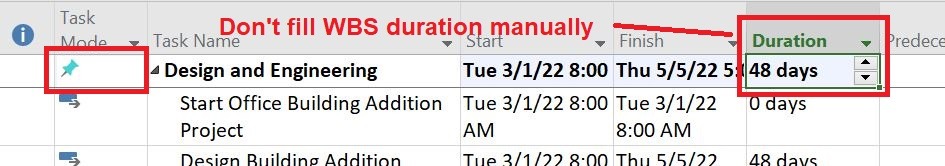
The thing to note is, do not fill in the duration in the WBS (summary task) section manually because when you fill it manually, the Task Mode will automatically change to Manual mode.
Continue to input all activities data according to the table above.
Also, read about how to create constraints in Microsoft Project.
Creating Relationships Between Activities
In the previous example, you created activities consisting of the activity’s name and duration. Now it’s time for you to make the relationship between the activities you have created before.
In Microsoft Project, you can create relationships between activities with the relationship types Finish to Start (FS), Start to Start (SS), Finish to Finish (FF), and Start to Finish (SF).
You can also add lead or lag if needed.
Lag is the waiting time between one activity and another activity. Lead is the duration of the overlap between one activity and another activity.
Also, read about what is lead and lag.
You can create a relationship between activities in the Predecessors column in the Gantt Table; the ways are as follows:
- Input the activity ID which is the predecessor in the Predecessors column.
Here are how to input the relationship between activities in the Predecessors column:
* Finish to Start (FS), written: <ID Predecessor>. Example: 2.
*Start to Start (SS), written: <ID Predecessor>SS. Example: 2SS.
*Finish to Finish (FF), written: <ID Predecessor>FF. Example: 2FF.
*Start to Finish (SF), written: <ID Predecessor>SF. Example: 2SF.
*If predecessors are more than 1, they can be separated by commas.
*Enter Lag or Lead if any:
Lag is written: + <lag time>. Example: 2SS + 2.
Lead is written: – <lead time>. Example: 22FF – 2.
- Next, as an exercise, enter the relationships data as shown in the table above in the Predecessors column.
- Some of the results, as shown in the image below:
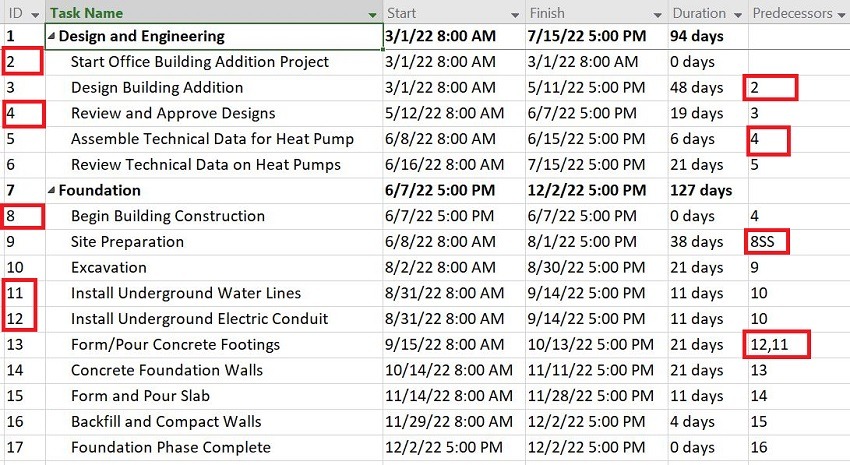
Continue until finished according to the data in the table as an exercise.
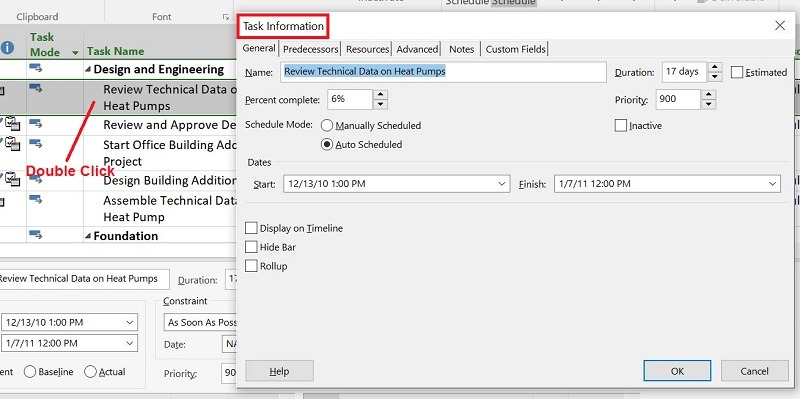
You can also view detailed data on each activity by:
- Double click on the Task Name column. The Task Information window will appear.
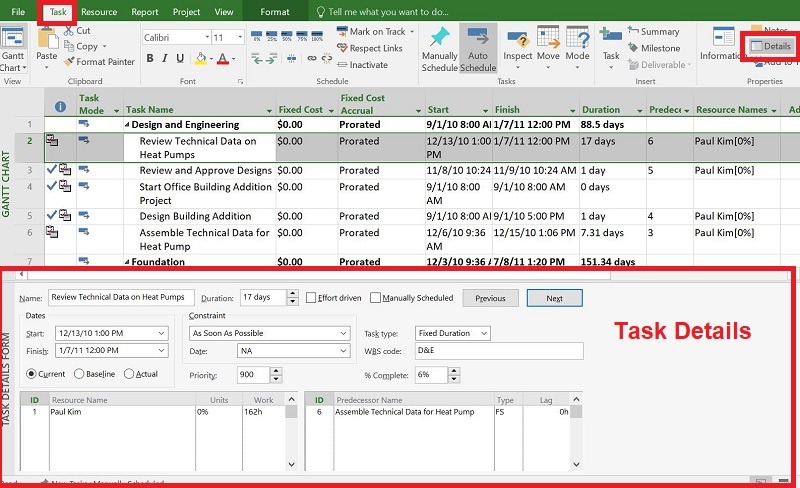
- In addition, you can also view activity details by accessing the Task -> Details menu. A detailed activity window will appear below the Gantt Table. Select an activity to view specific details.
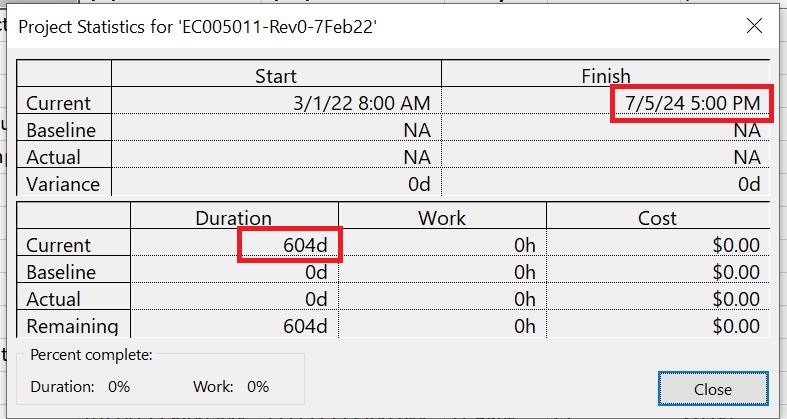
So far, after you input all relationships into the activities, the total project duration will automatically be calculated to 604 days, and the project will be completed on July 5, 2024.
You can view this information by:
Go to the menu Project -> Project Information -> Statistics….
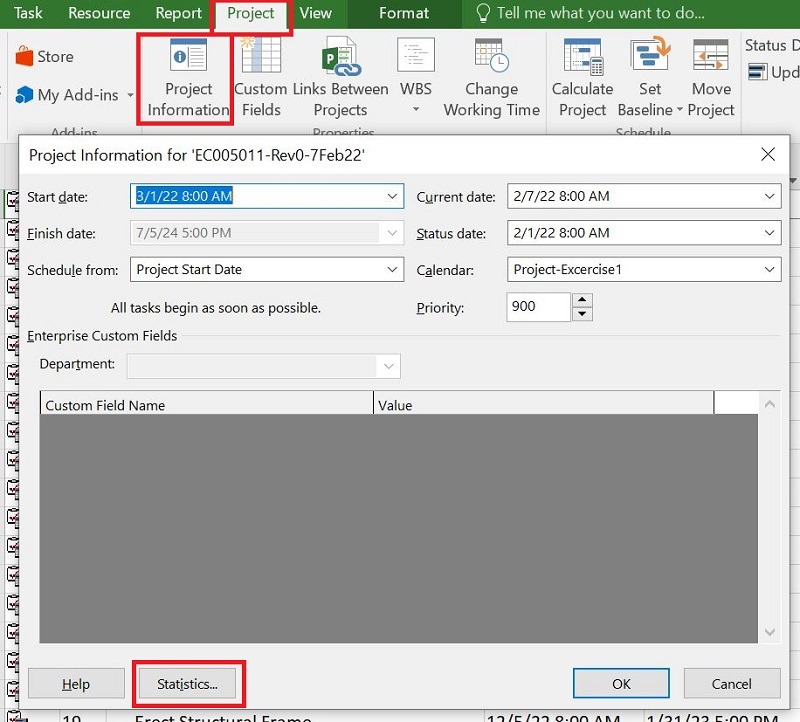
The results as previewed below: