EPS represents the highest structure of the project group hierarchy in Primavera. EPS is depicted with a golden pyramid shape. In Primavera, EPS can be further divided into sub-project groups as needed.
Some of the EPS data in Primavera will be accumulated from the data of a group of projects, including budget data.
The total data in EPS is the total of the project data contained in it (in EPS).
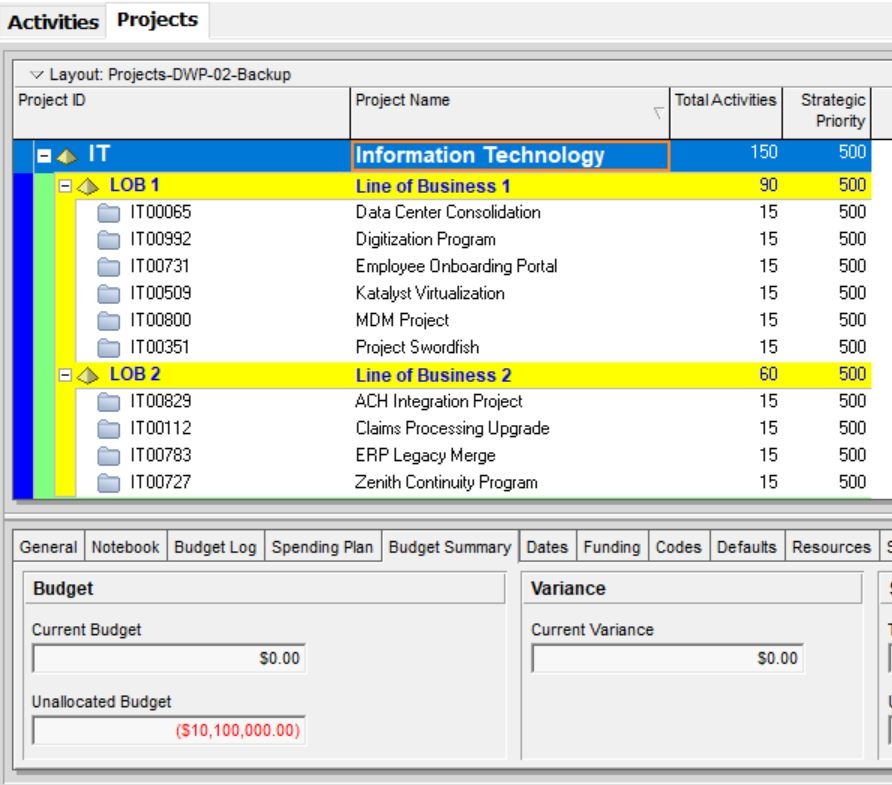
The following is an example of an existing EPS chart in a Haitang company. The EPS in the chart below is divided by category or type of Department in the Haitang Company.

To create an EPS like the chart above, perform the following steps:
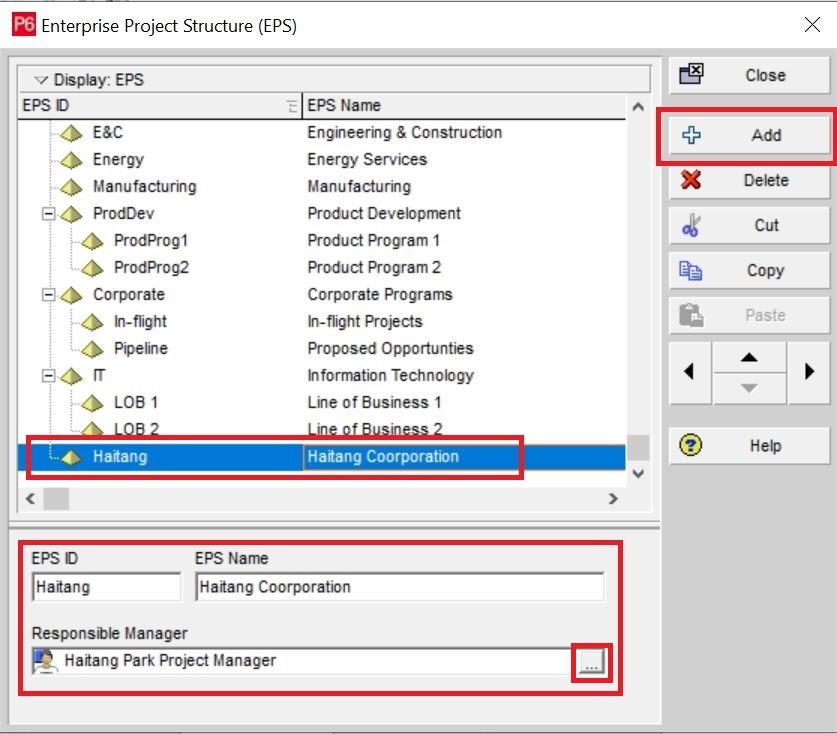
• On the menu bar, select Enterprise -> Enterprise Project Structure…

• Add EPS by clicking the Add button, then fill in the following data:
EPS ID : Haitang.
EPS Name : Haitang Corporation.
Responsible Manager: Haitang Park Project Manager.
Add Responsible Manager by selecting OBS (Also read: how to add OBS).
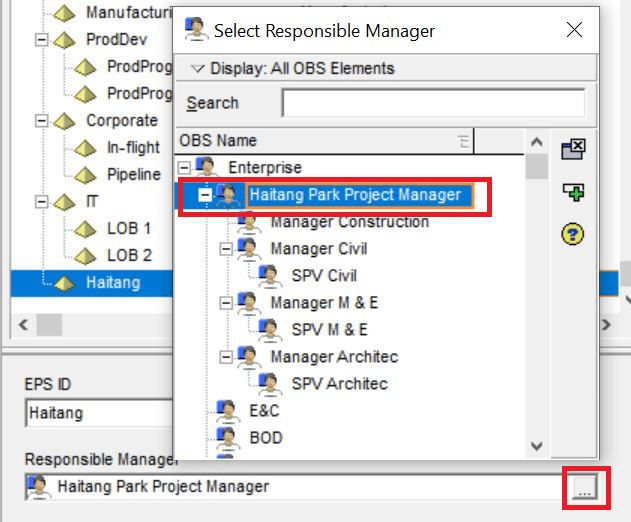
The results are as follows:
Continue by adding another EPS. To move the EPS hierarchy, you can use the left arrow (if the hierarchy is higher) or the right arrow (if the hierarchy is lower).

To change the view to Chart View, right-click on the parent level, then select Chart View as shown in the image.


You can change the display orientation to be vertical or horizontal. How to select one parent, right-click on the Option Bar (topmost), select Arrange Children -> select (Horizontal or Vertical).

To get the optimal view, right-click the Option Bar (Top Bar), select the Zoom menu -> Select (Zoom in, Zoom out, or Zoom to Best Fit).
